The Diagnostics Module
The Diagnostics module can be used to inspect system performance in both numerical and graphical presentations.
The following diagnostics are available:
CPU Core Usage
Shows the usage of the first 8 (virtual) CPU cores. If more than 8 cores exist a second tab named CPU Core Usage 2 will be available, showing cores 9 through 16. If core usage exceeds 75% the graph will be red.
Memory
Shows memory usage (green) and memory available (red) in GB. Additionally the memory consumption of a module's child processes can be display (yellow).
Audio
Shows the audio's latency, under- and overflows for the selected source (like AV Recorder). The latency is shown in ms and is corrected for any intentionally added latency for buffering and/or delay correction. Typically this value should be near 0 ms. Under- en overflows relate to corrections in the audio buffer and are displayed a a red line going down (underflow) or up (overflow) from the vertical middle of the graph. Ideally under- and overflows should never happen.
Video
Shows the video's time stamp delta and -delay and, for modules like NDI Input that use a PLL, the delta sigma for the selected module. The time stamp delta, plotted in green, is the increase in the video frame's time stamp, or in other words the duration of a video frame, measured at the output of the selected module. When the time stamp is not available (missing frame), a vertical red line is shown. The time stamp delay (yellow) is the difference in the video frame's time stamp between the input and output of the selected module, i.e. the time it takes the module to process the video frame. Delta sigma (dark grey) is the amount of compensation the PLL requires to lock onto the input clock. If SyncLok is enabled, a light grey line at the bottom will indicate SyncLok is achieved. The vertical scale is in milliseconds (ms), horizontally each pixels represents one video frame. The graph can be a very useful indicator for the stability, jitter and accuracy of the video clock and indirectly of the performance of each module and the underlying hardware.
Phase
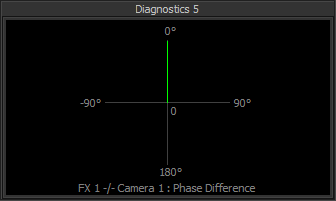
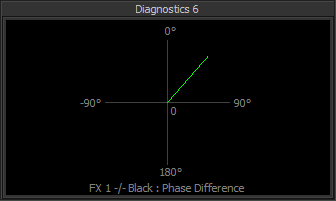
Shows the phase difference between the selected source and the selected Reference. The digit in the center of the meter indicates the number of "turns" (i.e. frames) the meter has made from zero.

Above image shows a diagnostic with the phase vector steady at 0 degrees, indicating the FX 1 bus is synchronised to Camera 1.

Here the phase vector is slowly rotating clockwise, indicating the FX 1 bus is not synchronised to the Black video signal (internal master clock).
Logic
A diagnostic similar to a logic analyser that can capture and display logical data of up to three sources based on a trigger event. Currently the logical data taken from a module is its frame clock, where an odd frame number is represented by a 1 and an even frame number by a 0. If no trigger pin is selected a transition from 0 to 1 in the first source (Module 1) will be used as a trigger. Currently supported triggers are the Video Switcher's ProgramBus and PreviewBus pins.
Data
Currently only supported by the Streamer module, this graph shows the stream's bit rate for the selected module. The vertical scale is in megabits per second (Mbps), horizontally each pixels represents one seconds
Right click the module to get access to its popup menu with the following entries:
Module
Module 1
Module 2
Module 3
Select the module that will be used as source for the diagnostic.
Reference
Select the module that will be used as reference for the Phase diagnostic.
Trigger
Select the module that will be used as trigger for the Logic diagnostic.
Copy
Makes a screen shot of the module and copies it to the clipboard.
Save As
Makes a screen shot of the module and saves it to disk.
Note the availability of menu entries varies with the diagnostic selected. Also note that, to save resources, diagnostics that are not selected will not be updated. If you require two or more diagnostics to be updated and/or visible at the same time, use one Diagnostics module per required diagnostic.